Vital Statistics
Tim B. Heaton
Tim B. Heaton, “Vital Statistics,” in Latter-day Saint Social Life: Social Research on the LDS Church and its Members (Provo, UT: Religious Studies Center, Brigham Young University, 1998), 105–132.
Abstract
This article reviews available information about demographics of the LDS Church. Fueled by a high growth rate, the membership has increased at an exponential rate. Along with this growth, the distribution of members has shifted from a largely Utah-based congregation to an international church. High fertility has been an important source of growth in the United States, but an aggressive program of proselyting has become the major source of growth outside the Mountain West. Demographic characteristics of the membership vary widely across countries. Because of rapid growth, many members of the Church are young and have had relatively few years of experience as adherents, especially in areas with high conversion rates. Some evidence indicates that LDS members have above average levels of socioeconomic attainment, but such information is not available in many countries. Information from selected countries indicates that family related characteristics such as marital status, family size, and household composition vary widely from country to country.
The membership of The Church of Jesus Christ of Latter-day Saints has undergone dramatic growth and increased geographic dispersion, and its composition is unusual in several respects. This discussion of LDS demographics will focus on (1) size, growth, and distribution of the population; (2) sources of growth and redistribution, including fertility, mortality, migration, conversion, and disaffiliation; and (3) composition of the membership in terms of age, gender, race, marital status, household structure, and socioeconomic status. Several of the statistics will be summarized for major geographical regions.
The Church implemented record-keeping procedures from its organization in 1830. Its records provide several sources of information. First, such vital events as the blessing of children (soon after birth) and baptism (after age eight) are recorded, and summary statistics are compiled. Second, a membership record is created and updated with information on marriages, ordinations to the lay priesthood, and geographic relocation. In the United States and an increasing number of other countries, membership records are computerized and some summary statistics are compiled. Third, every ward and branch is instructed to compile quarterly and annual reports that include information on the size of the congregation, numbers in attendance at church services, and group composition. Fourth, sample surveys of the membership have been conducted in the United States and some other countries by the Church’s Research Division. These surveys provide up-to-date information comparable to demographic data available at the national level, and provide a basis for comparison between Latter-day Saints and the host societies in which they live. Fifth, Latter-day Saints are encouraged to compile information on their ancestors. These genealogies provide interesting historical information on LDS demographics. Finally, some sources of data for national populations in the United States and Canada include religion, and these populations contain a sufficient number of Latter-day Saints to allow separate analysis and comparison between them and other groups.
The accuracy of data is limited by several factors. Record keeping is often assigned to lay members with insufficient time, resources, and training to ensure a high level of accuracy. Changing procedures and personnel also create inconsistencies in collection procedures. Undercounts, missing reports, delays in recording change, and computational errors detract from data quality. Despite these problems, it is assumed that official data sources generally mirror demographic changes in actual Church membership.
Size, Growth, and Distribution
Size and Growth
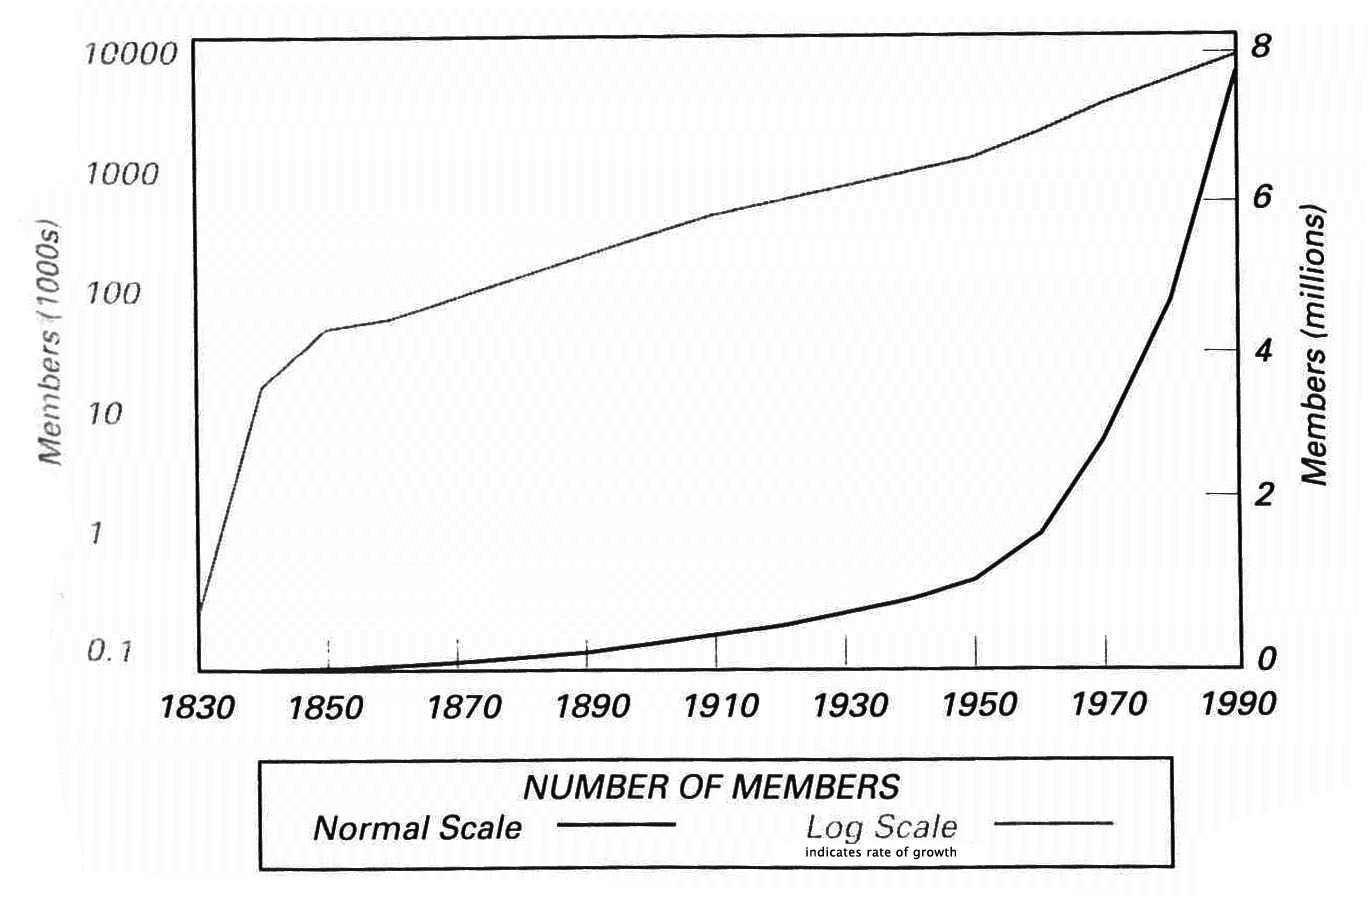
From its inception, the Church has viewed missionary work as divinely mandated and thus has been committed to increasing its membership. Beginning with the six people who officially organized the Church in 1830, the membership exhibits a classic pattern of exponential growth, as shown in fig. 4.1. Since 1860, the membership has grown at a relatively steady rate, doubling approximately every nineteen years. Growth was slower in the first half of the twentieth century, but picked up again after 1950. Membership stood at 7.76 million at the end of 1990.
Figure 4.1: Growth in Total Membership
The size of the LDS population by the end of 1990 is presented for all countries in Appendix 13 of Encyclopedia of Mormonism. In addition to the United States, with 4.27 million members, nine other countries have more than one hundred thousand members. Thirty-eight countries have at least ten thousand members. The ratio of Latter-day Saints per thousand in the national population varies widely, from a low of . 1 in Nigeria to more than three hundred in Tonga. Eight countries have at least 1 percent of their population belonging to the LDS Church. Recent growth rates also vary widely, from a low of 0.0 in Scotland to a high of .23 in Portugal. With some exceptions, growth rates are relatively low in Europe and the South Pacific, while Latin America and some areas of Asia and Africa have relatively high rates of growth.
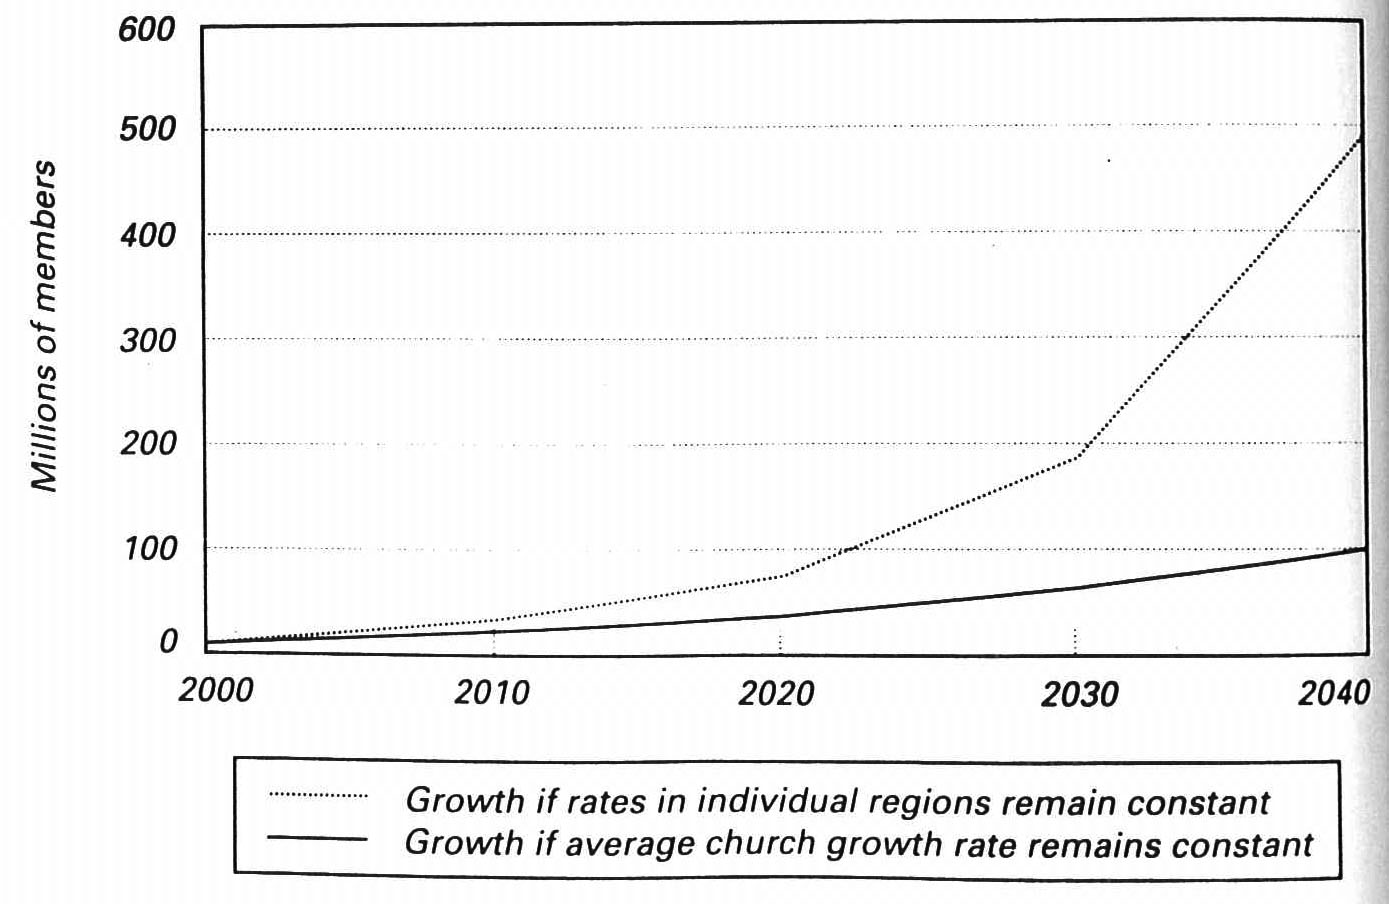
Although projections based on current growth rates are usually not precise predictions of the future, such projections do indicate future possibilities. Using past patterns of growth as a baseline, sociologist of religion Rodney Stark has projected an LDS population of 265 million by the year 2080. Using this projection, Stark has predicted that the LDS Church will become the next major world religion. If growth rates for the total membership observed between 1980 and 1989 remain constant, the membership will increase to 12 million by the year 2000, to 35 million by 2020, and to 157 million by the mid-twenty-first century, as shown in fig. 4.2. But some regions are growing faster than others. If regional rates of growth remain constant, growth will be even more dramatic in some areas.
Figure 4.2: Projections of Church Membership
Geographic Distribution
Growth has been accompanied by shifting distribution of the population. The first few decades were marked by several relocations of a core LDS community and by a substantial infusion of new convert immigrants from Great Britain and northern Europe. By the turn of the century, the core of the Church was firmly established in Utah (see fig. 4.3). In 1930 one of every two Latter-day Saints resided in Utah, an additional 30 percent lived in the western United States, and another 11 percent lived in the rest of the United States or Canada. In short, the membership was largely in the United States (90 percent) and concentrated in the Great Basin.
Figure 4.3: Distribution of Church Members
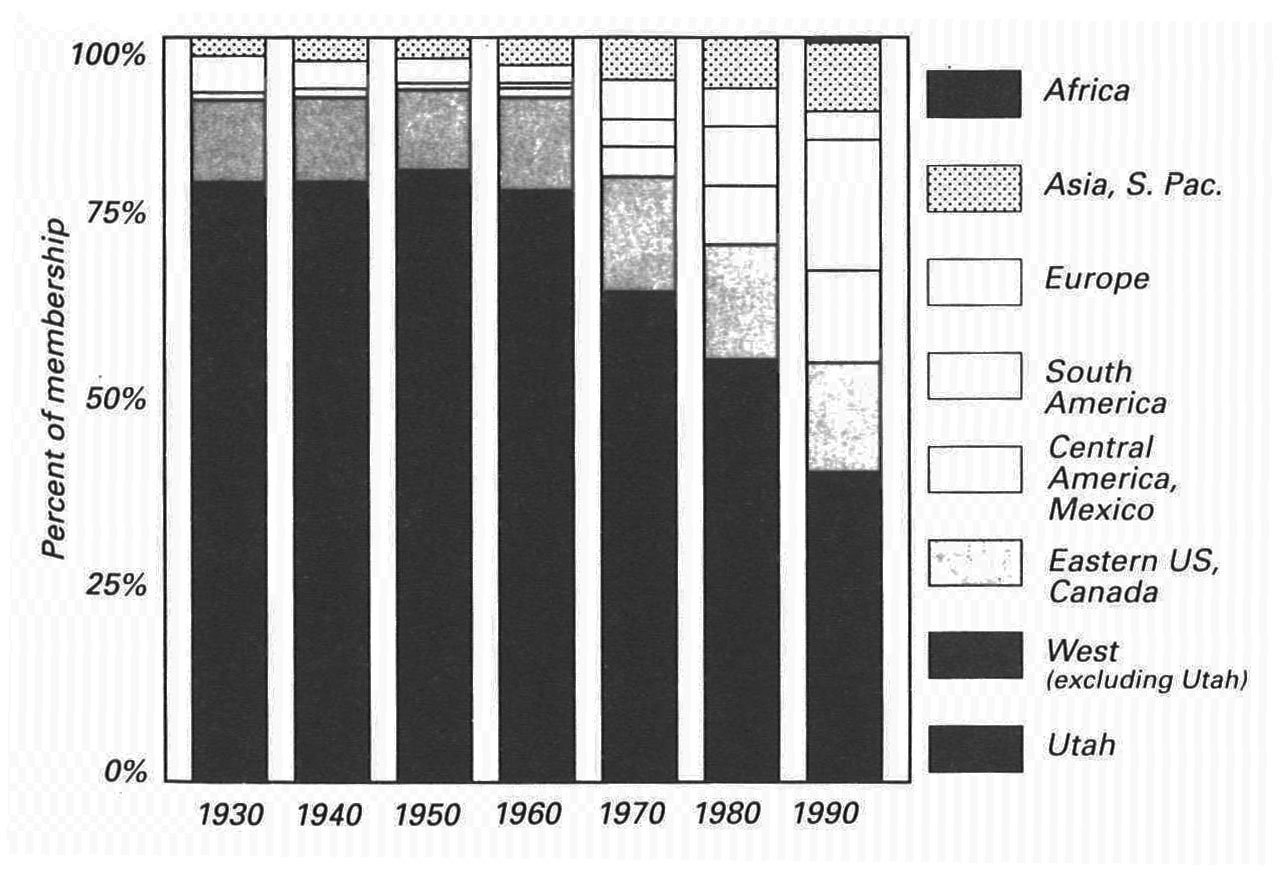
By 1960, 90 percent of the membership still lived in the United States, but Utah’s share had declined by 10 percent, and the other western states had gained 10 percent. After 1960, significant expansion of the international membership is evident. The share of members in South America increased from 1 percent in 1960 to 16 percent in 1989. In the same period, Mexico and Central America increased from 1 percent to 11 percent, and an Asian population appeared with 5 percent of the total. The share of the population has remained fairly stable for Europe (4–5 percent) and the South Pacific islands (3–4 percent). Although a majority of the membership still resides in the United States (57 percent), an increasingly international mix is evident. Rapid growth between 1980 and 1989 in countries such as the Philippines (from 57,000 to 213,000), Mexico (from 237,000 to 569,000), and Brazil (from 102,000 to 311,000), along with potential new sources of growth in Africa, East Europe, and Asia, implies dramatic shifts in the distribution of Church membership.
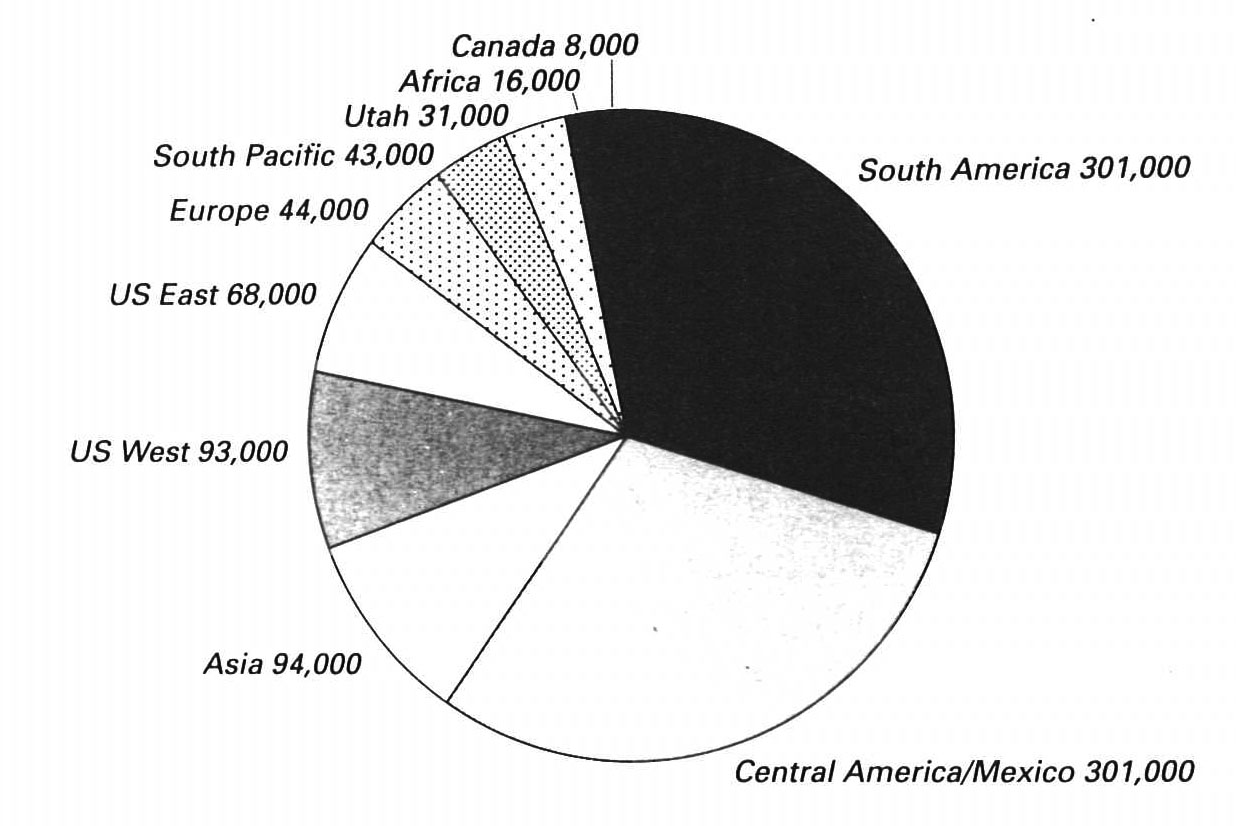
Another way to consider growth is to focus on the distribution of new members. Between 1987 and 1989, nearly a million new members were added. Fig. 4.4 shows the geographic location of this growth. South America, Central America, and Mexico contain more than 60 percent of these new members. Another 9 percent comes from Asian countries. Three percent of new growth is occurring in Utah, and other western states continue to be a solid source of new adherents. The total contribution of the United States and Canada amounts to one-fifth of the growth. The remaining 10 percent comes from Europe, the South Pacific, and Africa.
Figure 4.4: Geographic Distribution of the Million New Members Who Joined, 1987-89
Membership projections based on the assumption that each area will continue to grow at the same rate observed between 1980 and 1989 indicate that geographic shifts may become even more dramatic. The membership in the United States, Canada, and Europe is growing at a relatively slow pace, such that their percentage would drop to 40 percent in the year 2000, to 22 percent in 2010, and to about 11 percent by 2020. Although the African membership is growing at a high rate (14 percent annually), it has such a small base that it would constitute less than 3 percent by 2020. Asia would grow to more than 13 percent of the membership by 2020. But the biggest gains would be in Mexico and Central and South America. Collectively, these areas would increase their share to 46 percent in 2000, to 62 percent in 2010, and to 71 percent in 2020.
Sources of Population Change
The basic demographic equation states that population change equals births minus deaths plus net migration. For religious institutions, conversion and disaffiliation must also be discussed.
Fertility
Fertility refers to actual childbearing rather than to the biological capacity to give birth. LDS theology supports attitudes and behaviors that directly influence fertility (Bean, Mineau, and Anderton 1990). Consistent with a pronatalist doctrine, LDS fertility in the United States has been higher than the U.S. average, probably since the inception of the Church.
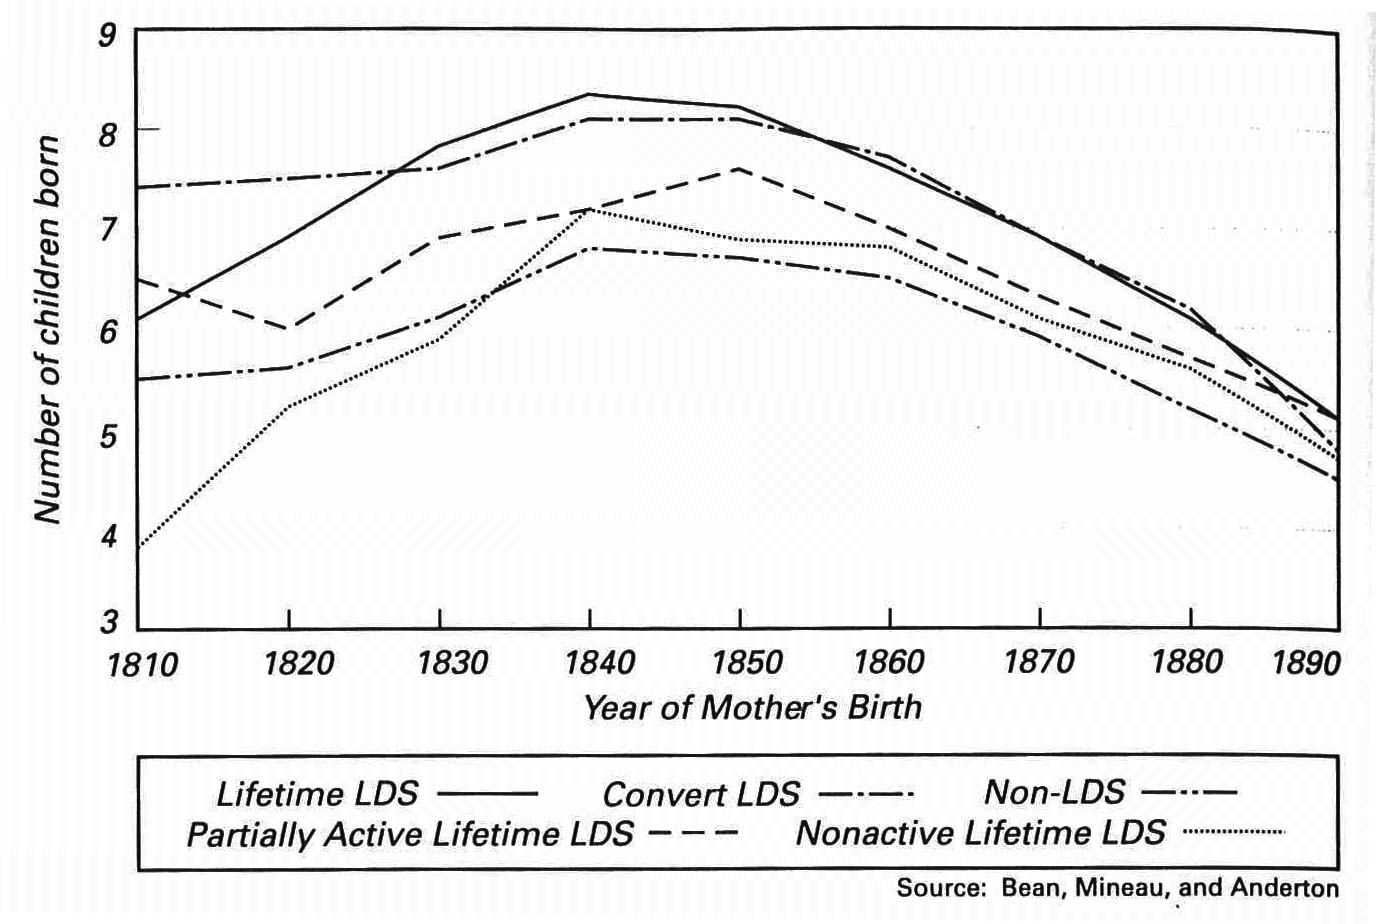
Genealogical records of persons living in Utah show a high average family size throughout the nineteenth century (see fig. 4.5). Family size is lower, however, for the earliest members of the Church (those born before 1830) than for those who reached the prime years of childbearing during the period of Utah settlement. This rise in fertility is consistent with the frontier hypothesis that low population density and easy access to new land promotes early marriage and larger families. As population growth and economic development led to a more urbanized, secularized society, family size declined. Family size also was larger for those who evidenced greater attachment to the LDS Church (lifetime-committed and converts) than for non-active LDS and for non-LDS residents. This difference is consistent with LDS teachings favoring increased birth rates.
Figure 4.5: Average Number of Children Born to Women. Utah Genealogies
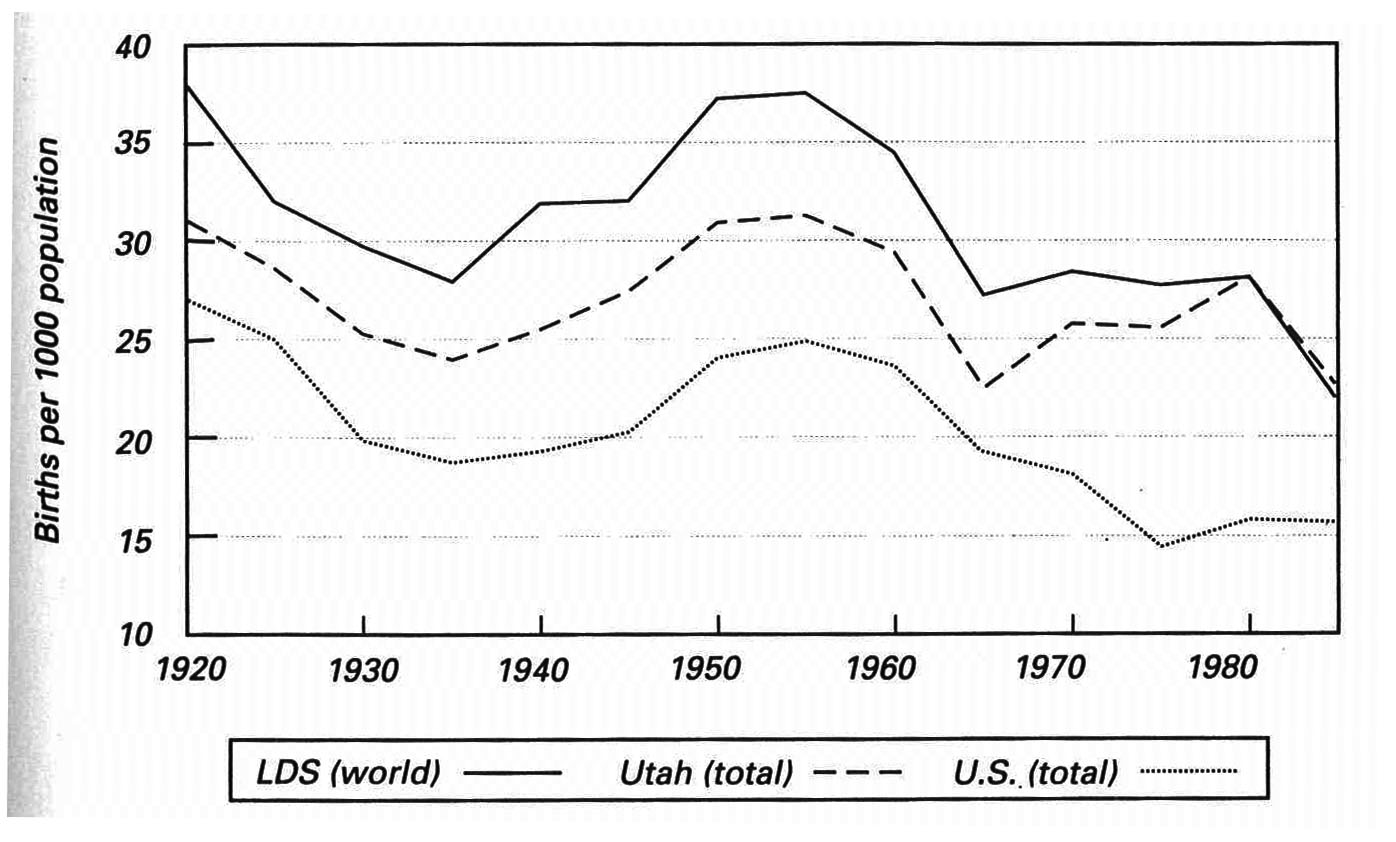
In the twentieth century, the LDS and Utah birth rates generally have been parallel with, but substantially higher than, birth rates in the United States, as shown in fig. 4.6. After 1965, the United States birth rate continued to decline, but Utah experienced another baby boom while the total LDS birth rate leveled off at a relatively high level. Since 1980, both Utah and total LDS birth rates have declined precipitously, though still remaining above total U.S. levels. As an increasingly larger share of the LDS population in the United States resides outside of Utah and the LDS population grows in other countries, neither the Utah nor the total LDS fertility rate provides an accurate measure of LDS fertility in the United States. Trends do, however, support the conclusion that Latter-day Saints respond to many of the same historical forces that affect family size of broader populations, and that LDS families have persistently been larger than the U.S. national average.
Figure 4.6: Birth Rates: LDS, Utah, and U.S., 1920-85
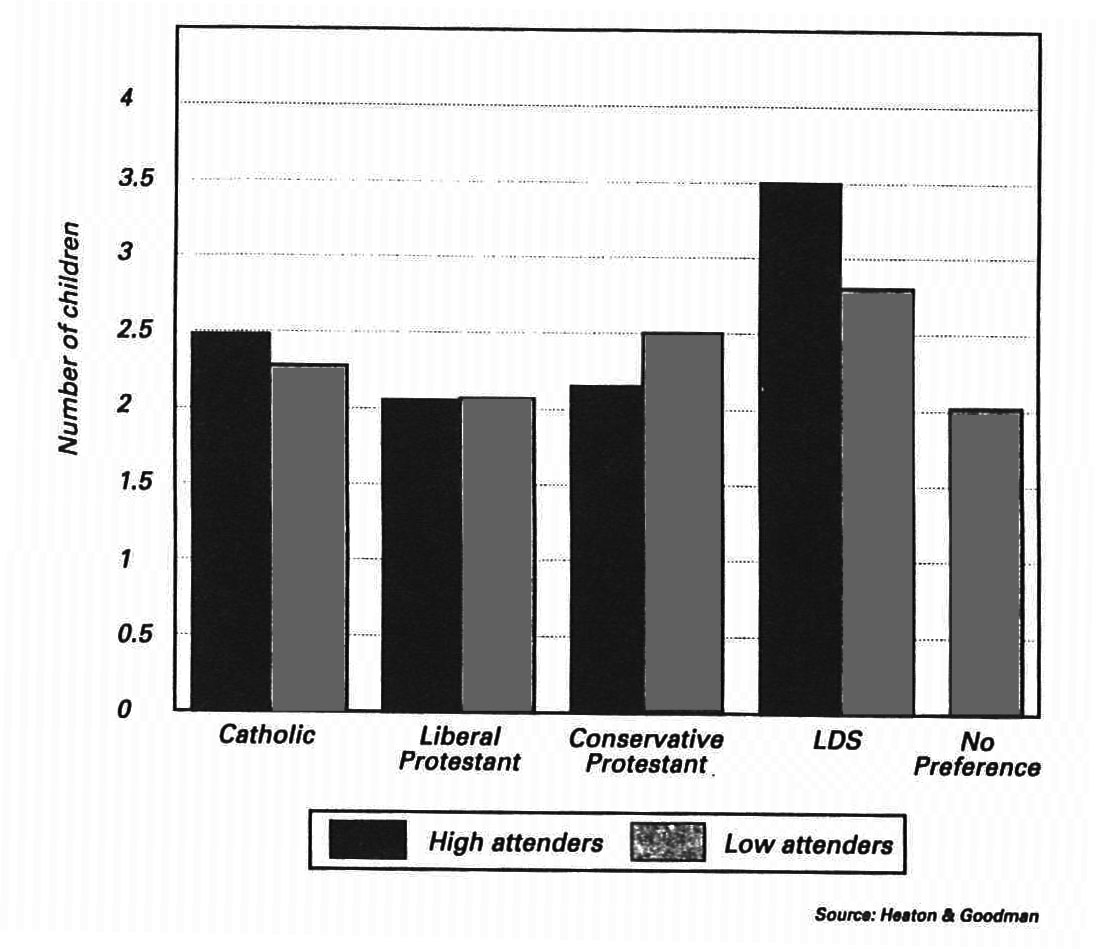
A comparison of LDS family size in the United States with family size in other major religious groups shows that LDS families are substantially larger, especially for Mormons who attend church regularly (see fig. 4.7). Latter-day Saints who regularly attend church average one child more per family than Catholics, and the difference is even greater in comparison with both liberal and conservative Protestants. Larger LDS family size is sustained by pronatalist religious beliefs, by contact with a reference group sharing similar values, and by socialization into the LDS subculture (Heaton 1989). As the Church spreads into other cultural contexts, it remains to be seen how the interplay between religious pronatalism and broader societal trends will be resolved. LDS fertility appears to be above the national average in Britain and Japan but below average in Mexico (Heaton 1989). Commitment to the LDS Church does not have uniform influence on family size in these three countries. These cross-cultural differences suggest that converts will be flexible in adapting to the pronatalist beliefs of their new religion.
High birth rates have been an important source of growth throughout LDS history. In the frontier era, high fertility was necessary to fuel population expansion. After 1900, conversion rates for several decades were relatively low, and fertility was the major source of growth. As LDS birth rates dropped in the United States in the late twentieth century, conversions in various countries became the major source of growth. Although LDS family size will most likely adjust to broader social trends, it seems that emphasis on childbearing will remain a distinctive feature of the religious tradition.
Figure 4.7: Children Ever Born in the U.S.A. by Religion and Church Attendance, 1981
Mortality
The LDS code of health, known as the Word of Wisdom, prohibits the use of alcoholic beverages, tobacco, coffee, and tea. Conformity to this code should reduce death rates. Utah death rates are below rates in the nation at large and in the mountain states for most major causes of death, including heart disease, cancer, cerebrovascular disease, accidents, pulmonary disease, pneumonia/
Studies of specific LDS populations in California (Enstrom 1989), Utah (Gardner and Lyon 1982; Lyon, Gardner, and West 1980), and Alberta, Canada (Jarvis 1977) show that LDS men are about half as likely to die of cancer as other men. LDS women also have lower cancer mortality, but the difference is not as great as for men. Latter-day Saints also have a lower risk of dying from cardiovascular and respiratory diseases. Death rates are lower for Latter-day Saints who have higher levels of religious participation. In short, adherence to the Mormon code of health appears to lower death rates from several diseases. But lower mortality is not as important as high fertility or conversion in creating high rates of growth in the LDS membership.
Migration
Migration was a common experience for early Latter-day Saints as the central settlement shifted from New England to Kirtland, Ohio; to Missouri; to Nauvoo, Illinois; and finally to Utah. During this early period, a major missionary effort was launched in Britain and western Europe. Converts were encouraged to gather to the center of Mormon activity, and the Church established a fund to support immigration from Europe. Indeed, the infusion of new members from Europe was crucial to expansion and possibly even survival of the Utah Church. In some years, the number of new baptisms reported by the British mission exceeded the total reported growth in LDS membership. Of the women in the Utah genealogical data base who were born between 1820 and 1849, more than 20 percent were born in Scandinavia, more than 40 percent in Great Britain, and an additional 2–4 percent in other European countries (Bean, Mineau, and Anderton 1990). Although the LDS Church had its beginnings in the United States, there was a significant period when a majority of the membership was foreign-born. By the turn of the century, however, more than 90 percent of members were born in Utah. Immigration had virtually ceased as a source of growth.
Gathering to Utah is no longer encouraged; indeed, members have been encouraged to remain and build the Church wherever they reside. LDS migration trends in the United States between 1976 and 1981 suggest, however, some persistent attraction to Utah (Larson 1989). Utah Mormons are somewhat less likely to move to another state, and those born in Utah are more likely to return to their state of birth in a subsequent move than are Mormons born elsewhere. Between 1976 and 1981, there was also a net flow of migrants into Utah. It appears that Utah, as the center of LDS culture, still has some power to draw migrants from other areas. There is virtually no information on migration patterns of Latter-day Saints outside of the United States.
Figure 4.8: Growth from Convert Baptisms, 1987-90
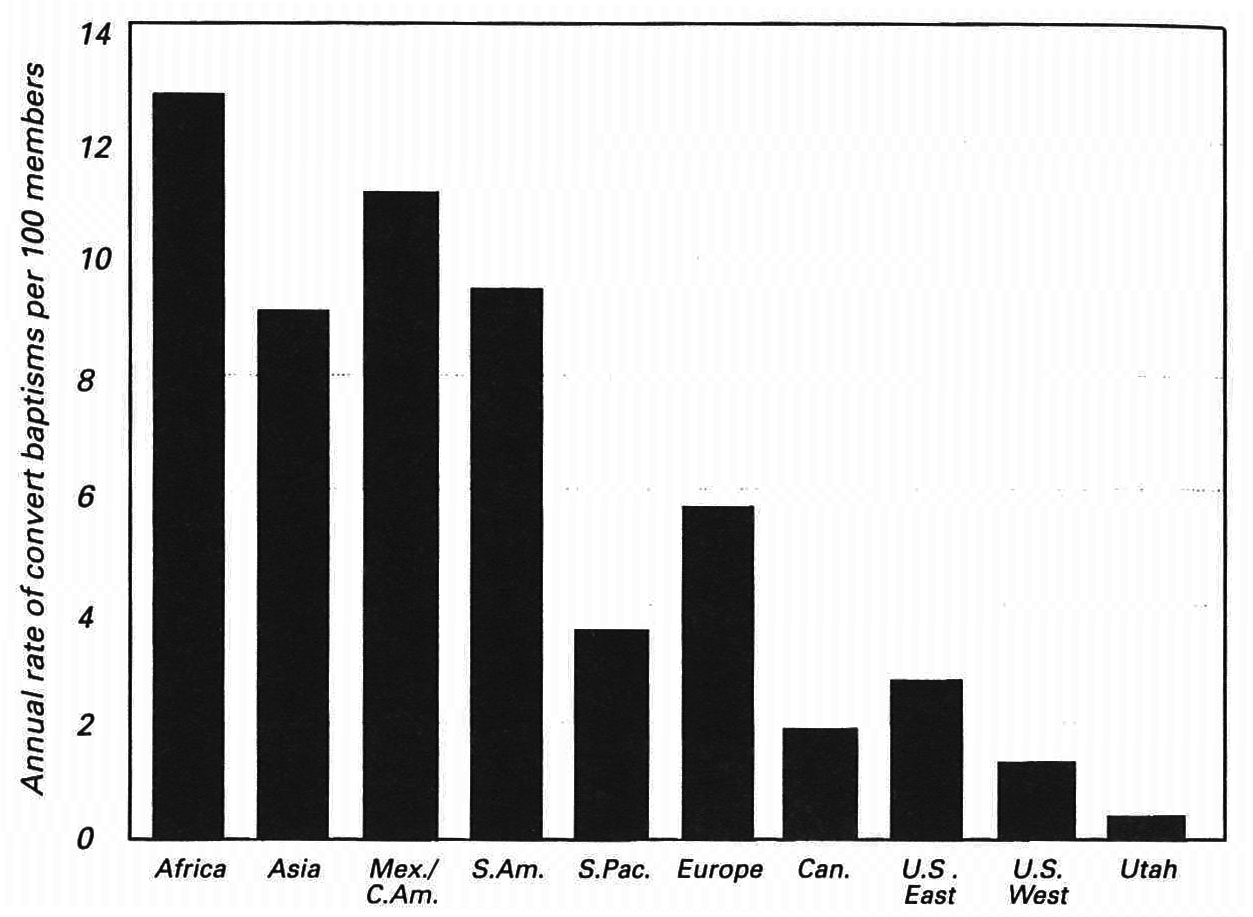
Conversion
As a result of missionary efforts, 330,877 convert baptisms were reported in 1990, up from 210,777 in 1980. In 1987–89, Church membership grew at approximately 4 percent per year because of convert baptisms (see fig. 4.8). Conversion rates tend to be higher in areas where the LDS presence is relatively recent than in areas with more extended contact. Growth due to conversion during this period varied from a high of 13 percent in Africa to a low of .5 percent in Utah. Latin America and Asia had rates a little under 10 percent, Europe was a little above 5 percent, the eastern United States and the South Pacific were around 3 percent, and Canada and the western United States were between 1 and 2 percent.
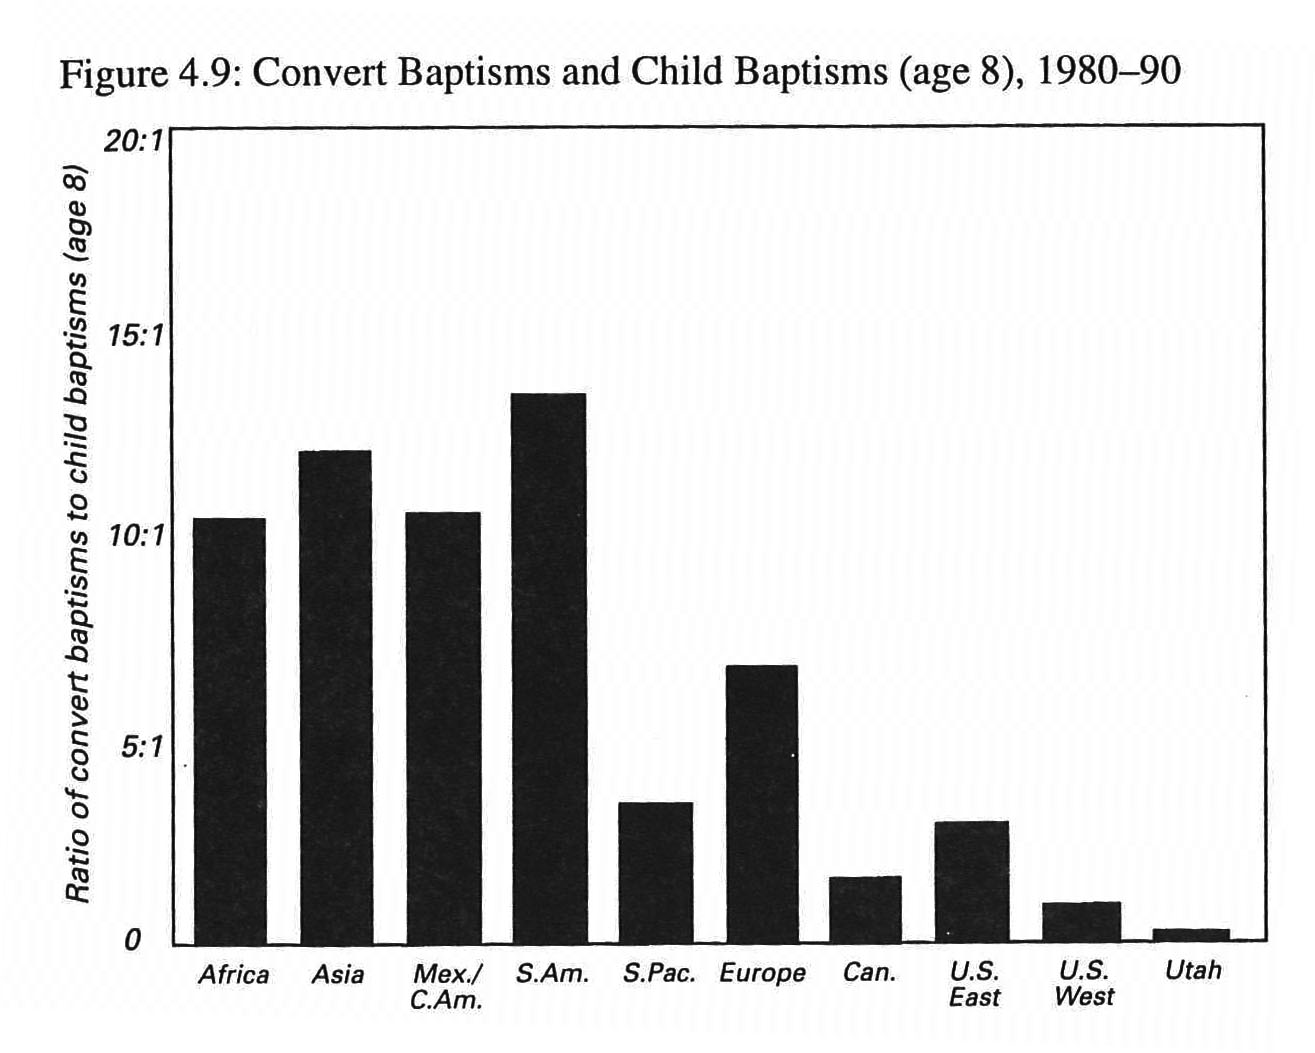
Reporting procedures render it impossible to get exact data on whether new members are children of members or new converts. An approximation can be made, however, by comparing the reported number of convert and eight-year-old baptisms. For the entire membership the ratio of convert baptisms to eight-year-old baptisms increased slightly from 2.59 for 1980–84 to 2.72 for 1985–89. The ratio varies dramatically from region to region as shown in fig. 4.9. In Asia and South America there are roughly fifteen converts for every eight-year-old baptized. The figure for Mexico and Central America is somewhat lower, with about ten converts per eight-year-old. Europe, Africa, the eastern United States, and the South Pacific have values between two and ten converts per eight-year-old, while Canada falls between one and two converts per eight-year-old baptized. In the western United States, converts and children are about evenly numbered, but in Utah, children baptized outnumber converts by about five to one. In most parts of the world, a majority of Latter-day Saints join the Church through conversion rather than family socialization. This trend stands in contrast to the late nineteenth and early twentieth centuries, when a majority of Mormons had been raised in an LDS family.
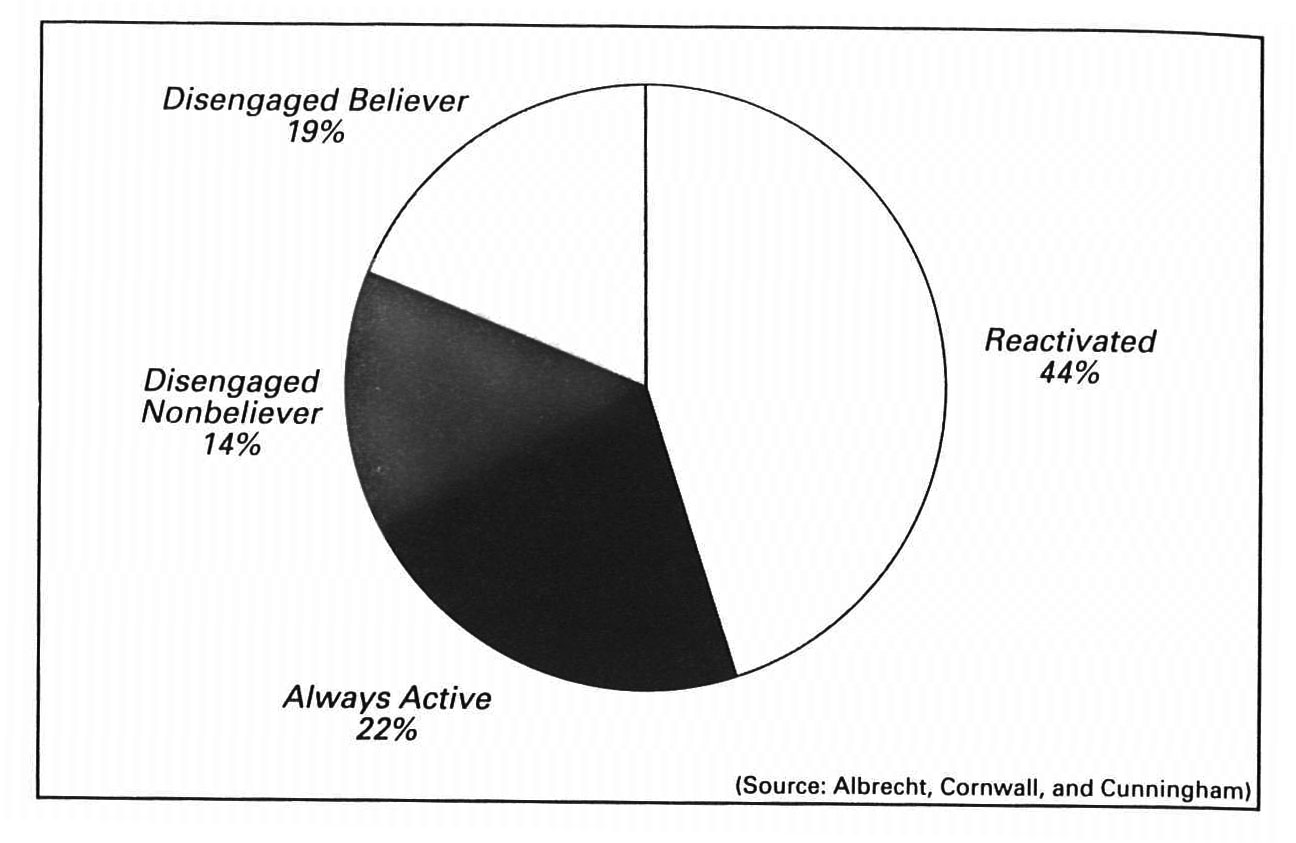
Figure 4.10: Projections of Church Activity by Age 65. LDS Membership in the U.S.A.
Disaffiliation
Not all whose names are on the Church records as members would consider themselves to be so. In the 1981 Canadian census, for example, eighty-two thousand people stated Mormon as their religious preference, yet LDS records reported 85,006 members. The difference implies that 3–4 percent of members on the records do not consider themselves to be Latter-day Saints. Official statistics on excommunication are not published, but formal excommunication or removal of names from the records is rare, probably affecting less than 1 percent of the membership. More common is the experience of disaffiliation or disengagement. A recent study of LDS members in the United States indicates that 44 percent experience a period of inactivity at some time and then resume religious involvement (regularly attending meetings), while 22 percent remain active throughout their entire lives (see fig. 4.10). Eight out often current members will become disengaged for a period of at least one year. About one of every five members retains his or her religious belief but does not attend meetings (disengaged believers); and only 14 percent remain disengaged nonbelievers.
Evidence of net change in membership comes from national social surveys of self-reported religious affiliation. One such survey reports a 36 percent net gain for Mormons among people who switch religions (Roof and Hadaway 1977).
In areas outside the United States where the Church is less well established and where most growth is from recent conversion, retention of members may not be as high. Attendance at sacrament meeting varies substantially. Asia and Latin America have weekly attendance rates of about 25 percent, Europe averages about 35 percent, and Africa, Canada, the South Pacific, and the United States average between 40 percent and 50 percent. Integration of new members is more difficult in areas of high growth due to conversion because there are fewer established members to help converts become acculturated.
Demographic Characteristics
Sex Ratios
LDS sex ratios are similar to those of national populations, except they are also greatly influenced by the conversion process.
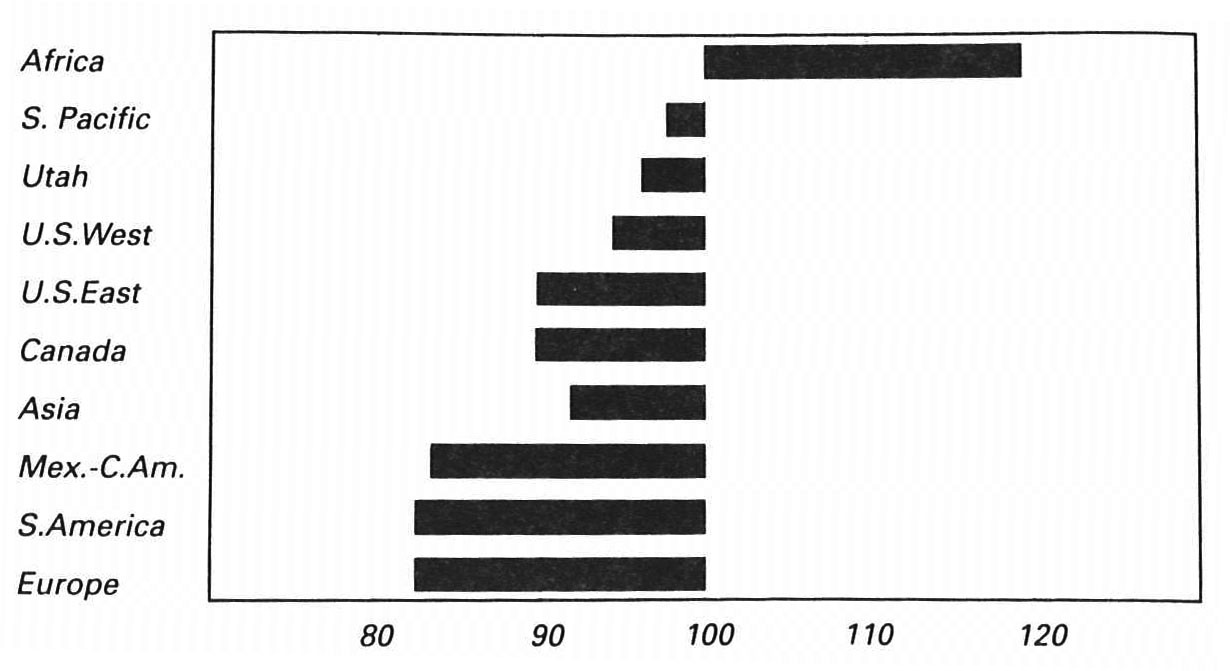
In most populations, there are slightly more male than female births, but males experience a higher mortality rate, such that females predominate at older ages. It can be problematic within the Church if sex ratios in certain areas are substantially unequal, since Latter-day Saints are encouraged to marry within their own faith and because a majority of higher-level leadership positions are not available to women, who do not hold the priesthood required to fill these positions. The ratio of males to females for geographic areas is shown in fig. 4.11. Africa is unusual because there are substantially more men than women who are members of the Church. This indicates that African men are more likely to be converted than are African women. Latter-day Saints in Utah, other western states, and the South Pacific have gender ratios of approximately 95 males per 100 females, which is the value for the total U.S. population. Ratios in the Church are somewhat below the U.S. average in the eastern United States, Canada, and Asia, and females outnumber males by a large margin in Latin America and Europe.
Figure 4.11: Gender Ratios by Region. Males per 100 Females, 1990
Information from the 1981 Church Membership Survey of the United States and Canada indicates that sex ratios become smaller for older age groups, for singles, and for those who attend church regularly (Goodman and Heaton 1986). For example, among singles over age thirty who attend church weekly, there are only nineteen men for every 100 women.
Figure 4.12: Child Dependency Ratios. Children per 100 Adults, 1990
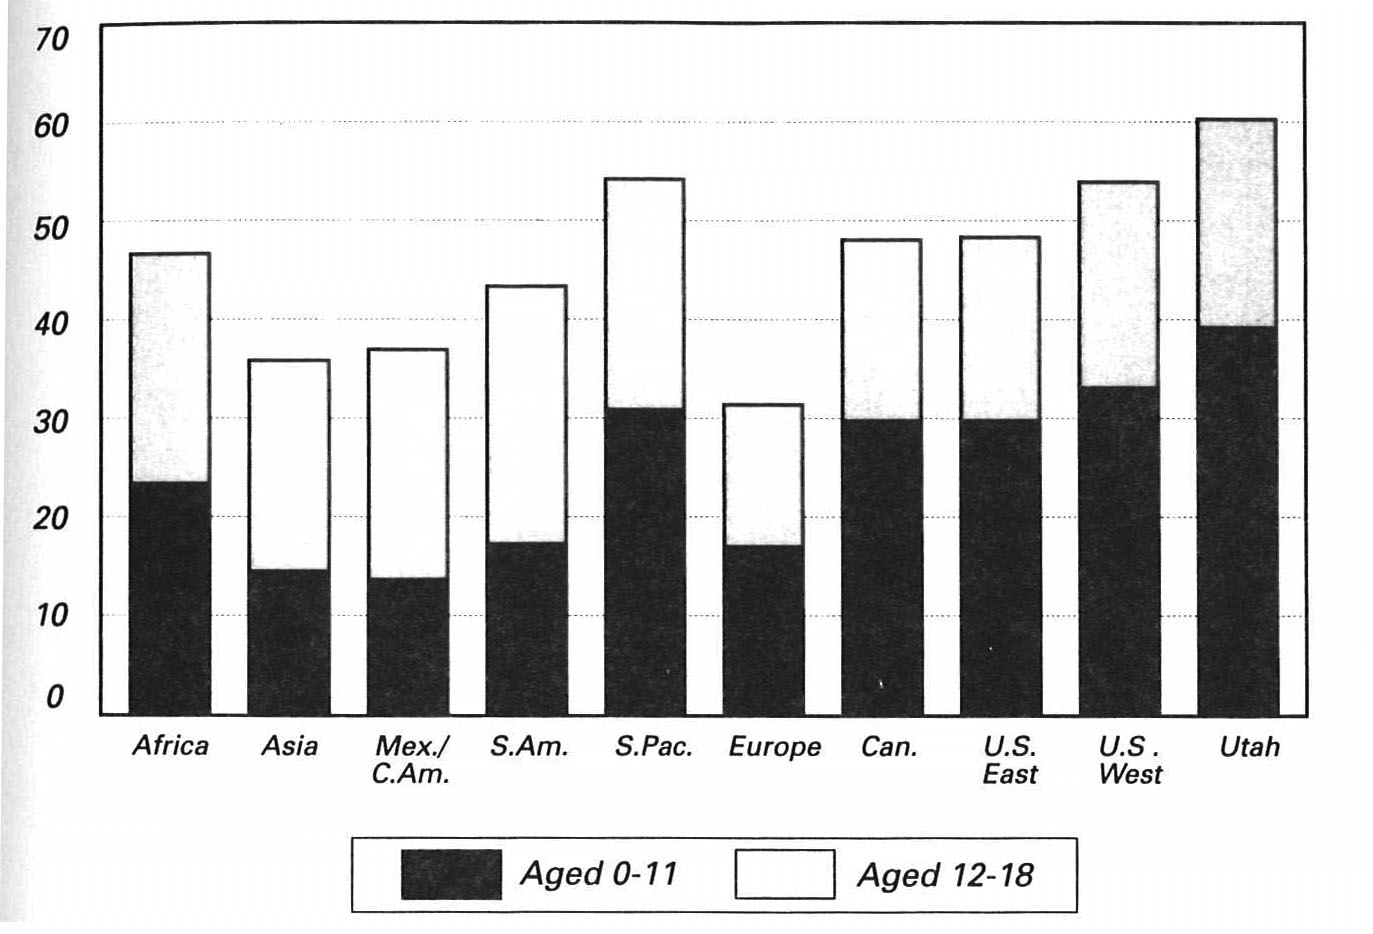
Age
Church membership statistics are reported separately for children under twelve, youth aged twelve to eighteen, and adults. The ratio of children to adults gives some indication of age structure, as shown in fig. 4.12. This ratio ranges from more than sixty children per one hundred adults in the South Pacific to about thirty children per one hundred adults in Europe. Ratios for young children (under twelve) are particularly high in Utah and the South Pacific, where fertility contributes a larger share of growth, but relatively low in areas where conversion rates are highest. On the other hand, ratios of children aged twelve to eighteen to adults are greater in areas where conversion rates are high. This is probably because a substantial number of converts join in late adolescence. Thus, the overall ratio is lowest in Europe because of relatively low fertility and conversion rates. Differences in ratios suggest substantial variability in the types of activities and programs that would be most beneficial to the membership in each locale.
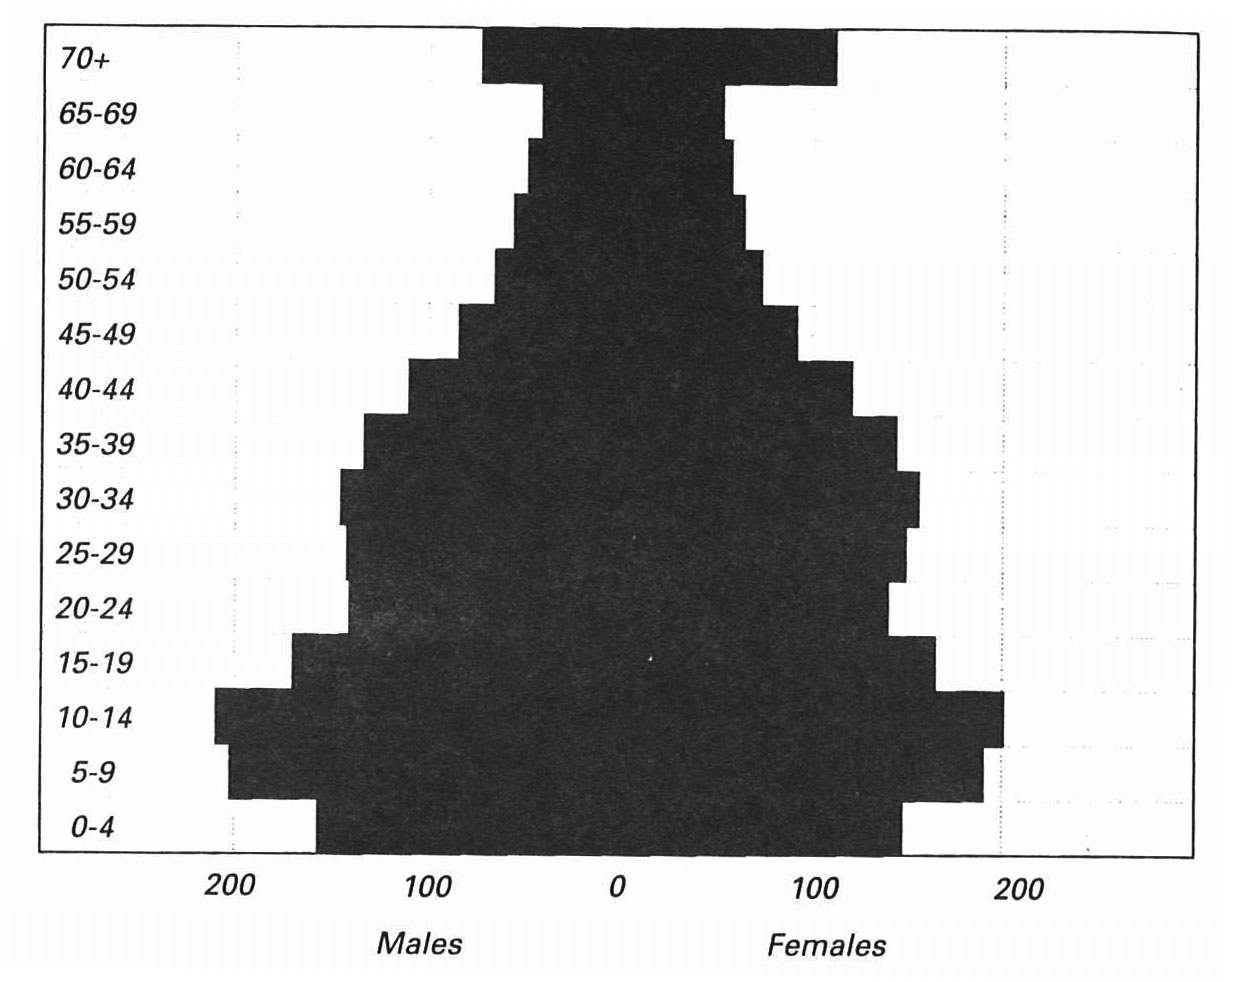
More detailed age categorization is possible where membership records have been computerized. The age-sex structure of the U.S. membership reflects several trends (see fig. 4.13). Smaller numbers in the two youngest age groups are a consequence of declining fertility in the 1980s. Smaller numbers in successive age groups over age fifteen are created by (1) the past history of high birth rates, which result in greater numbers at each younger age; (2) new converts, who tend to join in the late teens and twenties; and (3) mortality, which creates declining numbers at older ages. The shape of the age pyramid also suggests that the near future will bring declining numbers of young children, temporarily growing numbers who may serve missions or want to enroll in Church universities, a larger number available for marriage, and possibly a high fertility “echo” when the large ten-to-fifteen age group reaches childbearing age.
At the youngest ages, males outnumber females by a slight margin in the U.S. membership. A higher percentage of females converting to the Church creates a more equal sex ratio in the twenties. Higher female conversion and higher male mortality rates shift the numbers in favor of females in the thirties. At older ages, females outnumber males by a substantial margin.
Figure 4.13: Distribution by Age and Sex. 1000s of Members (U.S.), 1990
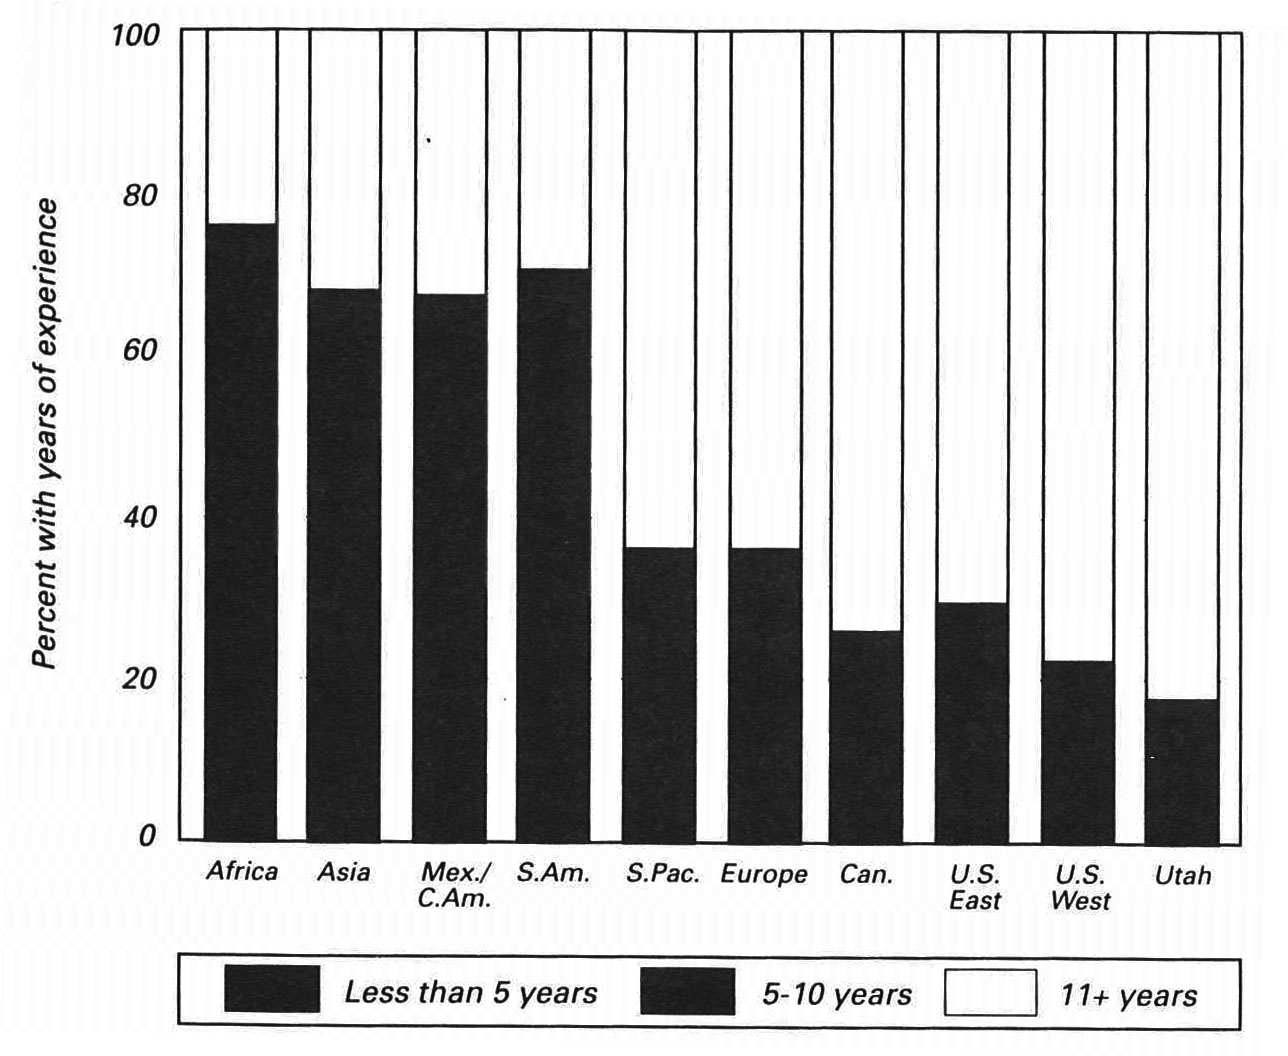
Another way to think of age from an organizational perspective is to focus on years of experience in the organization. Using membership totals for past years, one may estimate the percent of current members with various amounts of experience (see fig. 4.14). Consistent with patterns of growth, Africa, Asia, Mexico, and Central America have high percentages of members with limited experience as Latter-day Saints: Roughly two-thirds of the members have been LDS less than nine years, and between a third and a half have less than four years’ experience. Between one-fifth and one-third of those in the South Pacific, Europe, Canada, and the United States (excluding Utah) have fewer than nine years’ experience. In Utah, 84 percent of the membership has belonged for at least nine years. As one would expect, rapidly growing areas have only a small pool of well-seasoned Church members, while the opposite is the case for the membership of more established areas.
Figure 4.14: Years of Experience as LDS Church Members, 1990
Race-Ethnicity
Ethnic minorities are underrepresented in many LDS congregations. In the United States, where about 77 percent of the population were non-Hispanic whites in 1980, 95 percent of the LDS population were non-Hispanic whites. About 12 percent of the U.S. population and only 0.4 percent of the LDS population were black. Hispanics and Asians constituted about 8 percent of the U.S. population and less than 3 percent of the LDS population. American Indians had a higher percentage in the LDS Church (1.1 percent) than in the U.S. population (0.6 percent).
The spread of the Church in Asia, the South Pacific, and Africa signals an increasingly diverse ethnic membership. Straight-line growth projections discussed above suggest the possibility of a Hispanic majority by 2010. In any event, international expansion implies a decline in the dominance of white North Americans.
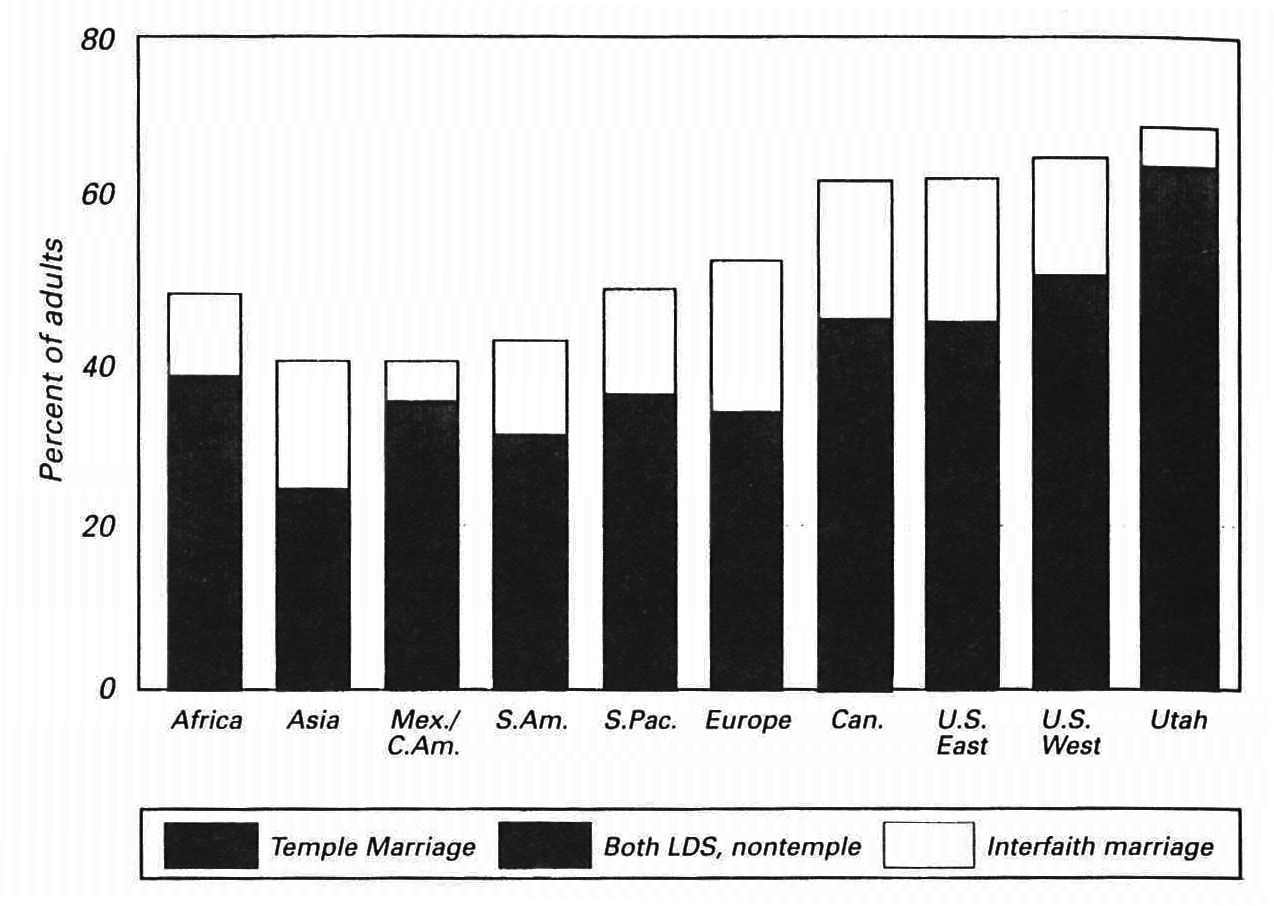
Figure 4.15: Percent Married and Type of Marriage, 1990
Marriage Rates and Household Composition
LDS teachings on marriage continue to be a distinguishing feature of belief and practice. In the early Church, plural marriage was one of the LDS family’s most widely noticed features. After it was taught openly in Utah, this practice increased quite rapidly. Of the Utah women born between 1830 and 1840 who ever married (they would have reached the prime marriage ages in the 1860s, when plural marriage was at its peak), about 30 percent entered into such marriages (Bean, Mineau, and Anderton 1990). The practice faded in the face of national pressures. Only about 12 percent of the women born between 1855 and 1859 entered polygynous marriages, and the practice was rare among women born after 1880.
In the United States in the late twentieth century, LDS members have higher rates of marriage and lower rates of marital dissolution than the national population. Marriage patterns vary in different areas of the Church (see fig. 4.15). Marriages performed in LDS temples are the LDS ideal. The percentage of adults in a temple marriage varies from about 45 percent in Utah to less than 2 percent in Mexico and Central America. Temple marriage is relatively common among Latter-day Saints throughout the United States and Canada but is relatively rare in other areas of the world. Marriage outside the temple is about as frequent as temple marriage and is the most common form of marriage outside the United States and Canada. In some areas, a significant minority of marriages involve one partner who is LDS and another who is not. These interfaith marriages involve only about 5 percent of the membership in Utah, Mexico, and Central America, but reach nearly 20 percent in other parts of the United States and in Canada. There are more than twice as many LDS women as LDS men married to spouses of another faith.
The total percent married ranges from just over 40 percent in Asia to almost 70 percent in Utah. Differences in the percent married are attributable to (1) high conversion rates among young people who have not yet married; (2) regional variation in the age at which people marry; and (3) regional variation in divorce rates and in the propensity for divorced people to convert to Mormonism.
Less information is available on LDS household composition, but sample surveys show characteristics of the United States, Britain, Mexico, and Japan in the early 1980s. In fig. 4.16, three types of households are distinguished: (1) married couples with one or both being LDS; (2) households headed by LDS singles (never married, divorced, or widowed); and (3) households with LDS children but in which neither husband nor wife nor single head is LDS. Married-couple households are the majority in the United States and Britain and form a slight majority in Mexico. Single households constitute 20–30 percent. Japan and, to a lesser degree, Mexico are characterized by many households in which children are the only LDS Church members. Married-couple households are further divided into both-member and one-member couples. Both-member marriages predominate in the United States, Britain, and Mexico, but one-member marriages are more common in Japan. A significant portion of both-member marriages have not been solemnized in a temple, especially outside of the United States.
Figure 4.16: Composition of Households with at Least One LDS Member
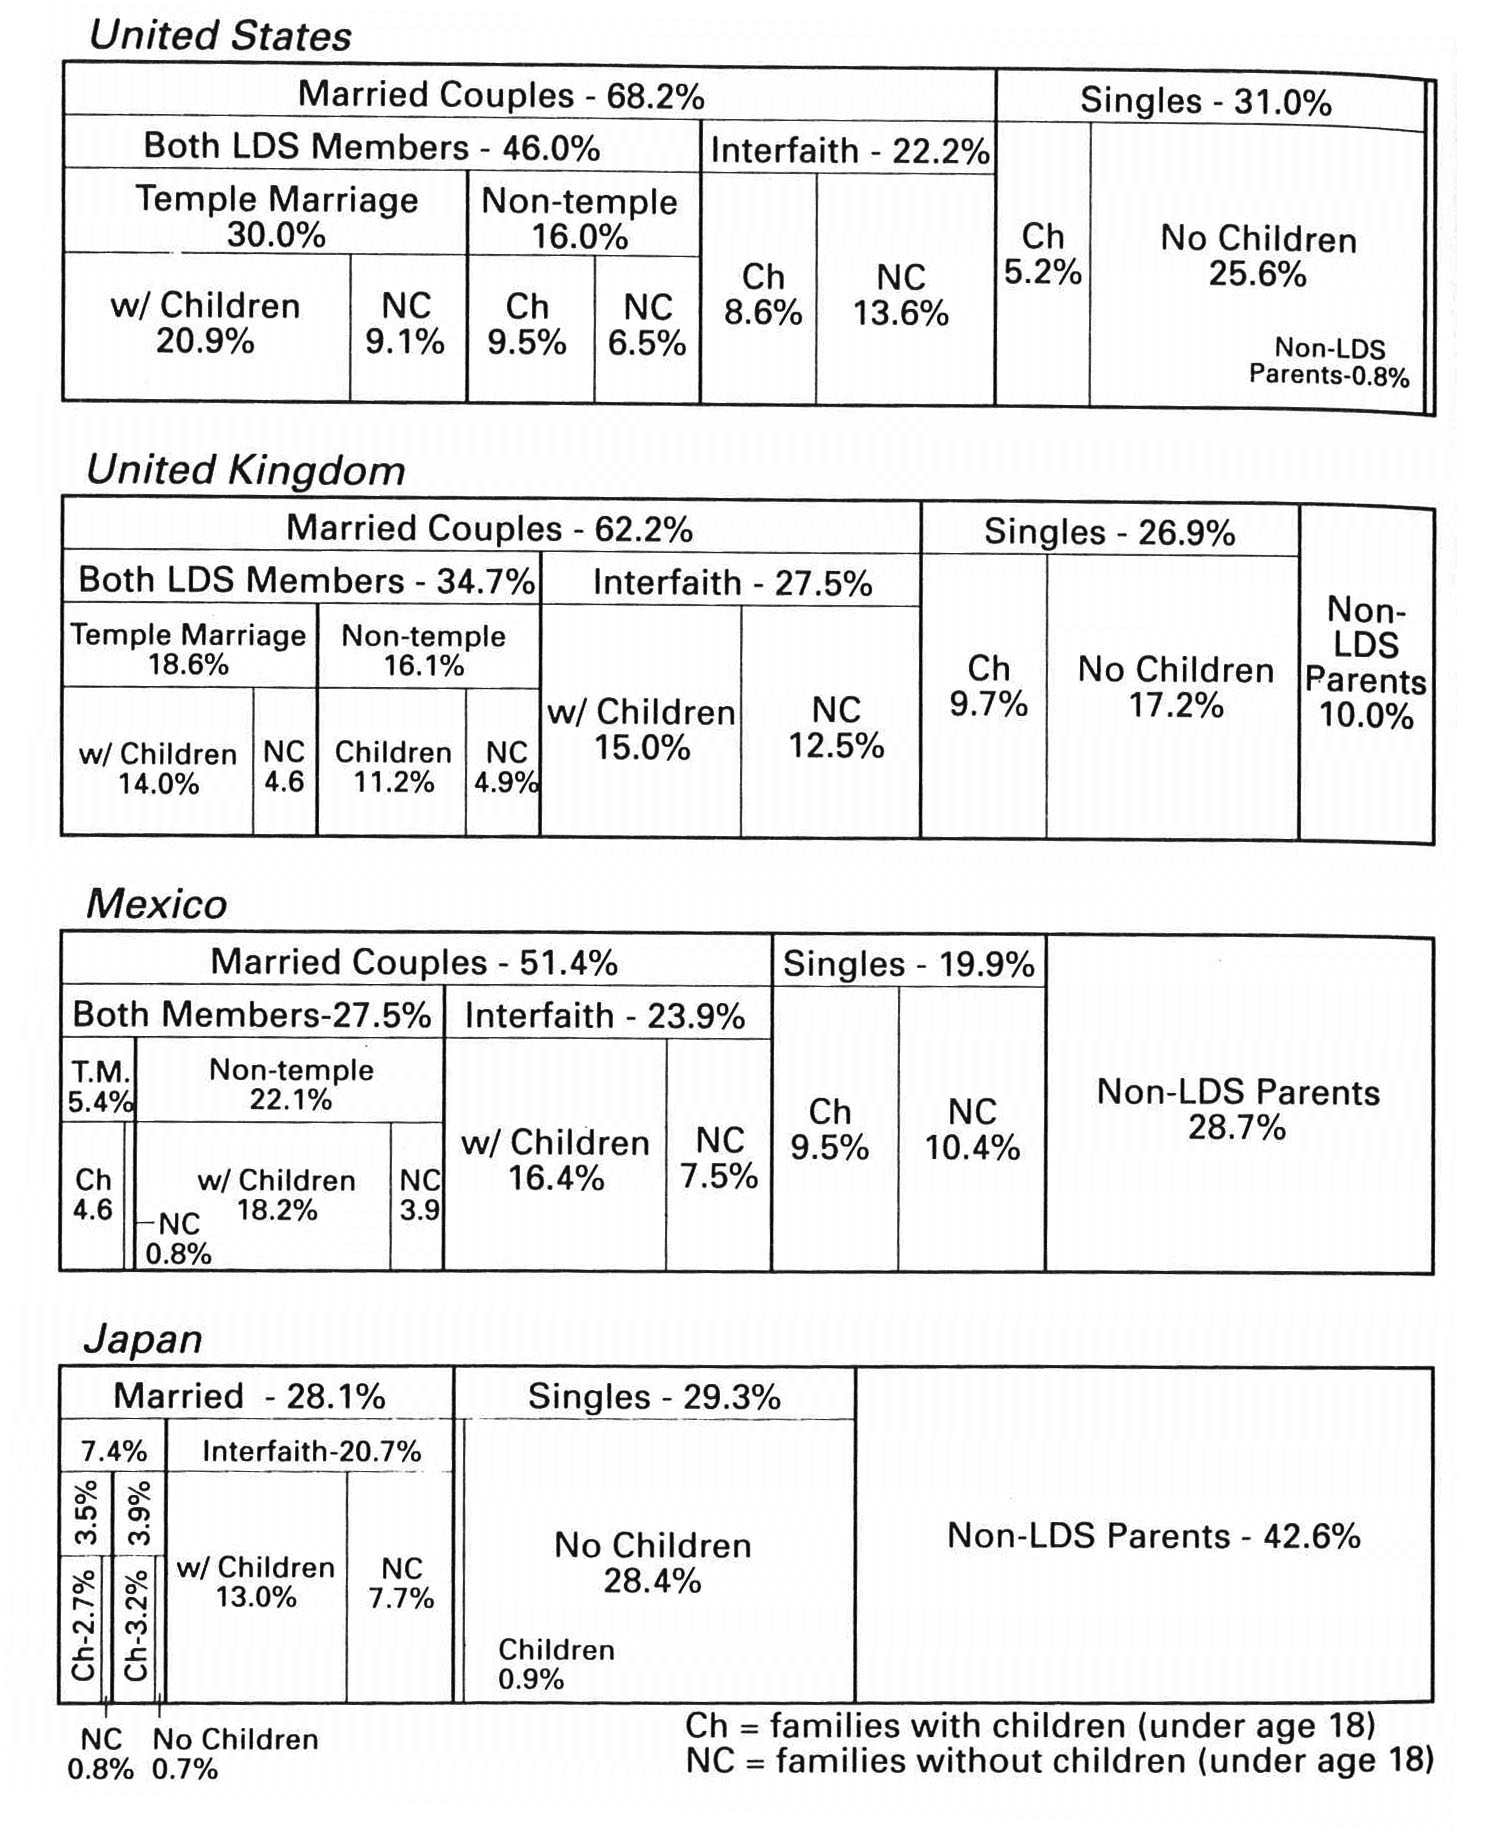
Regarding the presence of children (under age eighteen) in households, a majority of married-couple LDS households in each country have children, but the percent of married-couple households without children living at home is substantial (43 percent in the United States, 35 percent in Britain, 24 percent in Mexico, and 33 percent in Japan). In many of these cases, the children are grown and have left their parents’ home. Although a majority of single-headed households do not have children, a proportion (ranging from 0.9 percent in Japan to 9.7 percent in Britain) are single-parent families.
The distribution of households does not fit any uniform pattern across countries. The idealized vision of a family with a husband and wife married in the temple and children present describes only one out of five LDS families in the United States and less than 3 percent of LDS families in Japan. Information for these four countries suggests that the household composition of the LDS membership is diverse.
Socioeconomic Status
Membership records and statistical reports from local areas do not include information on socioeconomic status. Sample survey data are available from a few countries, but the data must be interpreted with caution because survey response rates favor those who participate in Church activities most frequently. Socioeconomic information may be more indicative of participating members than of all members.
Studies in the United States indicate that LDS educational attainment is above the national average and that, compared to the population as a whole, Latter-day Saints are more likely to be both highly educated and religiously involved (Albrecht and Heaton 1984). Possible explanations for the positive role of education are that the Church has emphasized the importance of gaining knowledge and that education facilitates participation in an organization staffed by lay volunteers.
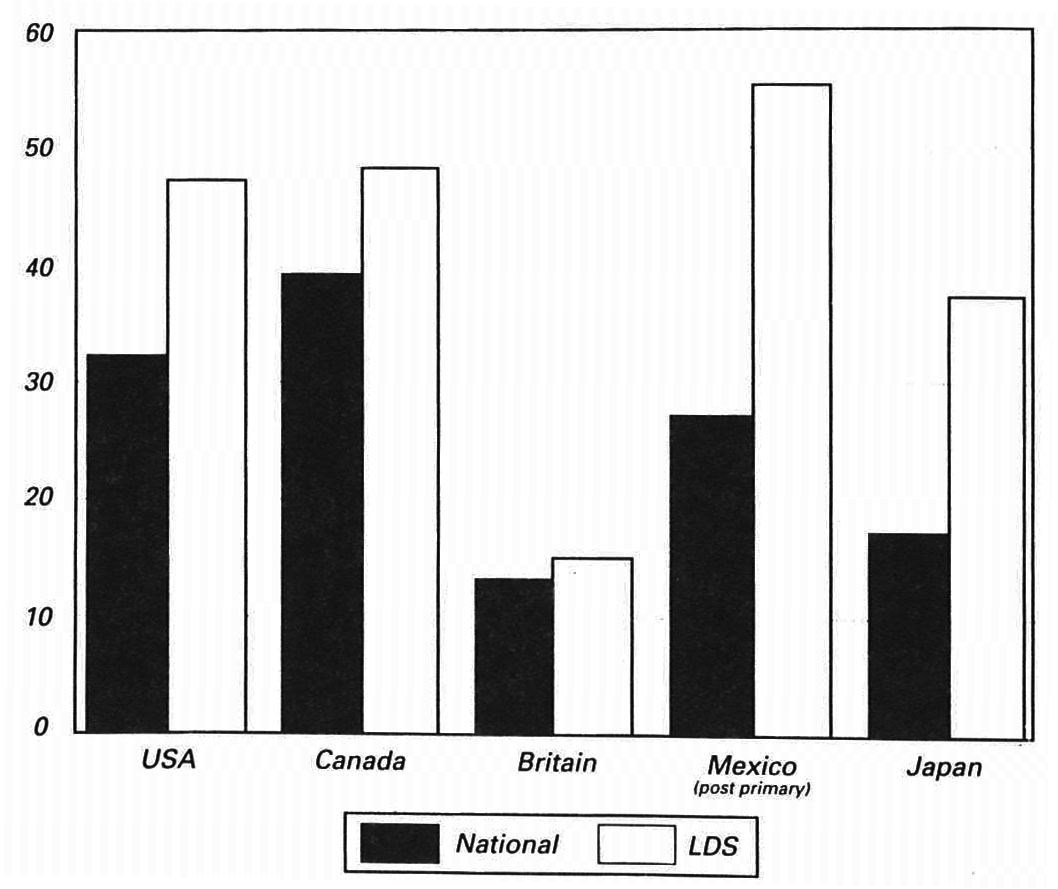
A similar orientation toward educational achievement can also be observed in other countries. Fig. 4.17 shows that in Japan, Latter-day Saints are more than twice as likely as the national population to have college experience. In Britain, Church members are only slightly above the national average in educational experience. In Mexico, where the comparison standard is postprimary rather than college experience, Church members exceed that national rate by a factor of two. The percentage with postsecondary education is higher among Canadian Saints than the national population. Less-representative samples also show above-average LDS educational attainment in some African countries (Heaton and Jacobson 1990).
Figure 4.17: Percent of Adults with College Experience, 1981-83
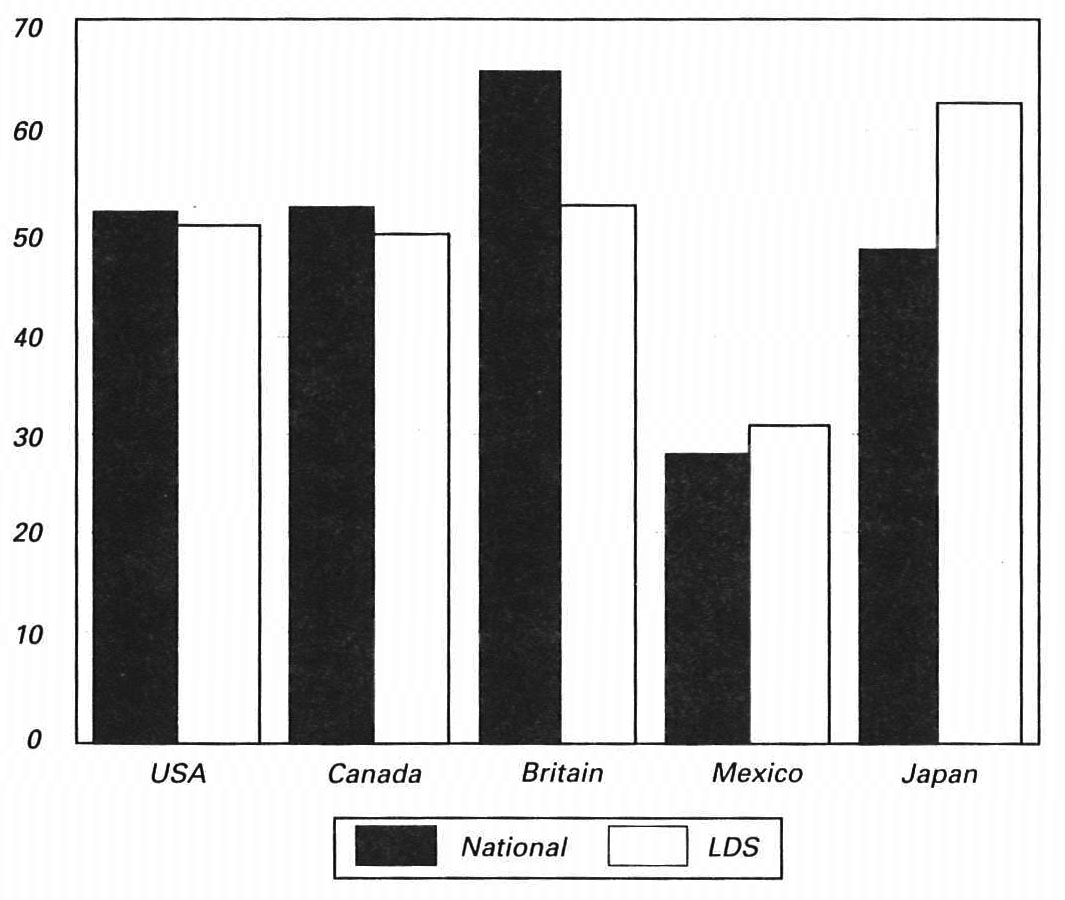
Adult male employment rates are quite high and relatively uniform throughout most countries of the world, and available evidence indicates that averages for LDS males are similar to national averages. Female employment is much more variable. In the early 1980s, about half of LDS adult women were in the labor force in the United States, Canada, and Britain (see fig. 4.18). These percentages were virtually identical to the national averages. LDS women in Mexico were less likely to be in the labor force when compared with LDS women in the United States, but were still slightly above the national average for Mexico. Japan presents a contrast, as 63 percent of LDS women are in the labor force. This is notably higher than the rate for LDS women in other countries or for Japanese women as a whole.
Figure 4.18: Percent of Women in the Labor Force, 1981-83
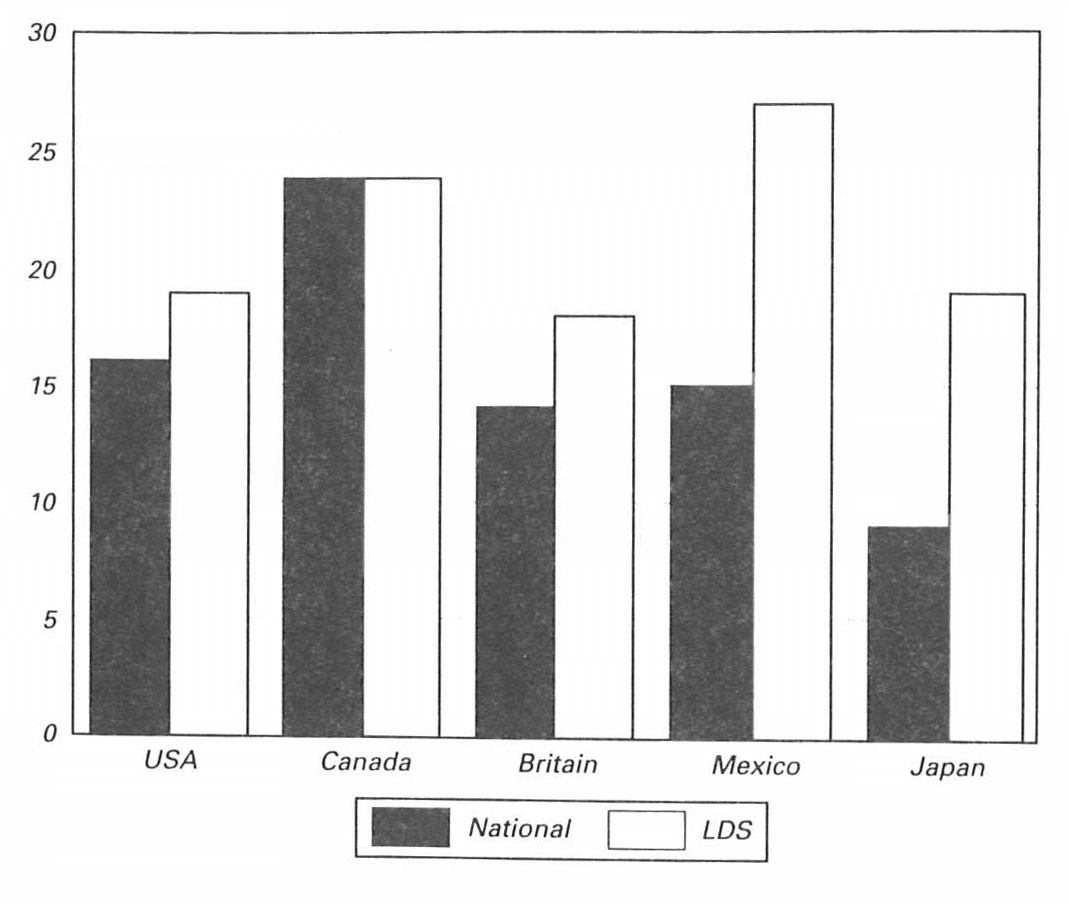
A comparison of the occupational status of Latter-day Saints with national populations shows that within each country Church members are at least as likely to have professional occupations (see fig. 4.19). In Japan and Mexico the LDS percentages are substantially higher than those for the total population (the Mexico comparisons are based only on six cities where the LDS survey was conducted). African data also suggest that Church members have above-average occupational attainment (Heaton and Jacobson 1990). Although information on education, employment, and occupation is limited to a few countries, patterns suggest that Mormons have average or above-average socioeconomic attainment. In some Third World countries, joining an American-based church may be associated with upward mobility. Missionary efforts may also focus, either intentionally or unintentionally, on middle- or upper-level socioeconomic groups. Finally, an emphasis on achievement and self-sufficiency may promote and develop higher socioeconomic attainment within the membership.
Figure 4.19: Percent of LDS in Labor Force in Professional Occupations, 1981-88
Information on income is more difficult to obtain than for education and employment because of national differences in reporting and individual reluctance to divulge income. Surveys conducted in the early 1980s indicate that LDS income is about the same as the national average in some countries. In the United States, reported average household income of Church members was $22,294, slightly above the national average of $21,063. In Britain, 33 percent of Latter-day Saints and 32 percent of the national population had incomes below £5,000, while 3 percent of Church members and 4 percent of the national population had incomes above £10,000. In the 1981 Canadian census, LDS men were a little above the national average ($17,222, compared to $16,918), but LDS women were a little below average ($7,243, compared to $8,414). In Mexico and Japan the percentage of income going to the poorest and richest fifths of the population were approximately equal for Latter-day Saints and the national population. Although LDS family income may be slightly above the national average in the United States, LDS per capita income is lower, due in part to larger family size.
Measures of poverty, which take into account household size, show that 13 percent of U.S. LDS households fell below the poverty level in 1981, compared to a national figure of 14 percent. As in the U.S. population as a whole, female-headed LDS households with children are especially prone to fall below the poverty level (Goodman and Heaton 1986).
As the LDS Church expands in developing countries, the economic status of the membership will continue to change. A rough approximation of economic status of the membership can be computed by multiplying the per capita gross national product (GNP) of each country by the proportion of all LDS membership in that country and summing the product across all countries. For 1974 this procedure yields a per capita LDS GNP of $6,044, or 88 percent of the U.S. national per-capita GNP. By 1987, the LDS figure had become only 75 percent of the national GNP. Projections of Third World growth presented above suggest even greater decline in the average income of the total LDS membership in the coming years.
References
Albrecht, Stan L. and Tim B. Heaton. 1984. “Secularization, Higher Education, and Religiosity.” Review of Religious Research 26:43–58. Also in this volume.
Bean, Lee L., Geraldine P. Mineau, and Douglas L. Anderton. 1990. Fertility Change on the American Frontier. Berkeley: University of California Press.
Enstrom, James E. 1989. “Health Practices and Cancer Mortality among Active California Mormons.” Journal of the National Cancer Institute 81:1807–14. Also in this volume.
Gardner, John W. and Joseph L. Lyon. 1982. “Cancer in Utah Mormon Men by Lay Priesthood Level.” American Journal of Epidemiology 116:243–57.
Goodman, Kristen L. and Tim B. Heaton. 1986. “LDS Church Members in the U.S. and Canada: A Demographic Profile.” AMCAP Journal 12:88–107.
Heaton, Tim B. 1989. “Religious Influences on Mormon Fertility: Cross-National Comparisons.” Review of Religious Research 30:401–11.
Heaton, Tim B. and Kristen L. Goodman. 1985. “Religion and Family Formation.” Review of Religious Research 26:343–59.
Heaton, Tim B. and Cardell K. Jacobson. 1990. “The Globalizing of an American Church: Mormonism in the Third World.” Unpublished manuscript.
Jarvis, George K. 1977. “Mormon Mortality Rates in Canada.” Social Biology 24:294–302.
Larson, Don C. 1989. “A Descriptive Analysis of United States Mormon Migration Streams.” Unpublished paper presented to the Western Social Science Association, Albuquerque, NM, April.
Lyon, Joseph L., John W. Gardner, and Dee W. West. 1980. “Cancer Incidence in Mormons and Non-Mormons in Utah during 1967–75.” Journal of the National Cancer Institute 65:1055–61.
Roof, Wade Clark and C. Kirk Hadaway. 1977. “Review of the Polls: Shifts in Religious Preference—The Mid-Seventies.” Journal for the Scientific Study of Religion 16:409–12.
Smith, James E. 1986. “Mortality.” Pp. 59–69 in Utah in Demographic Perspective, edited by Thomas K. Martin, Tim B. Heaton, and Stephen J. Bahr. Salt Lake City: Signature.
Stark, Rodney. 1984. “The Rise of a New World Faith.” Review of Religious Research 26:18–27. Also in this volume.
